Executive Summary:
The Mobile Network in 2014
Global mobile data traffic grew 69 percent in 2014. Global mobile data traffic reached 2.5 exabytes per month at the end of 2014, up from 1.5 exabytes per month at the end of 2013.
Last year’s mobile data traffic was nearly 30 times the size of the entire global Internet in 2000. One exabyte of traffic traversed the global Internet in 2000, and in 2014 mobile networks carried nearly 30 exabytes of traffic.
Mobile video traffic exceeded 50 percent of total mobile data traffic for the first time in 2012. Mobile video traffic exceeded 50 percent of total mobile data traffic by the end of 2012 and grew to 55 percent by the end of 2014.
Almost half a billion (497 million) mobile devices and connections were added in 2014. Global mobile devices and connections in 2014 grew to 7.4 billion, up from 6.9 billion in 2013. Smartphones accounted for 88 percent of that growth, with 439 million net additions in 2014.
Globally, smart devices represented 26 percent of the total mobile devices and connections in 2014; they accounted for 88 percent of the mobile data traffic. (For the purposes of this study, smart devices refers to mobile connections that have advanced multi-media/computing capabilities with a minimum of 3G connectivity.) In 2014, on an average, a smart device generated 22 times more traffic than a non-smart device.
Mobile network (cellular) connection speeds grew 20 percent in 2014. Globally, the average mobile network downstream speed in 2014 was 1,683 kilobits per second (kbps), up from 1,387 kbps in 2013.
In 2014, a fourth-generation (4G) connection generated 10 times more traffic on average than a non‑4G connection. Although 4G connections represent only 6 percent of mobile connections today, they already account for 40 percent of mobile data traffic.
The top 1 percent of mobile data subscribers generated 18 percent of mobile data traffic, down from 52 percent at the beginning of 2010. According to a mobile data usage study conducted by Cisco, the top 20 percent of mobile users generated 85 percent of mobile data traffic, and the top 1 percent generated 18 percent.
Average smartphone usage grew 45 percent in 2014. The average amount of traffic per smartphone in 2014 was 819 MB per month, up from 563 MB per month in 2013.
Smartphones represented only 29 percent of total global handsets in use in 2014, but represented 69 percent of total global handset traffic. In 2014, the typical smartphone generated 37 times more mobile data traffic (819 MB per month) than the typical basic-feature cell phone (which generated only 22 MB per month of mobile data traffic).
Globally, 46 percent of total mobile data traffic was offloaded onto the fixed network through Wi-Fi or femtocell in 2014.
In 2014, 2.2 exabytes of mobile data traffic were offloaded onto the fixed network each month. Without offload, mobile data traffic would have grown 84 percent rather than 69 percent in 2014.
Per-user iOS mobile devices (smartphones and tablets) data usage marginally surpassed that of Android mobile devices data usage. By the end of 2014, average iOS consumption exceeded average Android consumption in North America and Western Europe.
In 2014, 27 percent of mobile devices were potentially IPv6-capable. This estimate is based on network connection speed and OS capability.
In 2014, the number of mobile-connected tablets increased 1.6-fold to 74 million, and each tablet generated 2.5 times more traffic than the average smartphone. In 2014, mobile data traffic per tablet was 2,076 MB per month, compared to 819 MB per month per smartphone.
There were 189 million laptops on the mobile network in 2014, and each laptop generated 3.2 times more traffic than the average smartphone. Mobile data traffic per laptop was 2.6 GB per month in 2014.
Average nonsmartphone usage doubled to 22 MB per month in 2014, compared to 11 MB per month in 2013. Basic handsets still make up the vast majority of handsets on the network (68 percent).
The Mobile Network Through 2019
Mobile data traffic will reach the following milestones within the next 5 years:
● Monthly global mobile data traffic will surpass 24.3 exabytes by 2019.
● The number of mobile-connected devices exceeded the world’s population in 2014.
● The average global mobile connection speed will surpass 2 Mbps by 2016.
● Because of increased usage on smartphones, smartphones will reach three-quarters of mobile data traffic by 2019.
● Monthly mobile tablet traffic will surpass 2.0 exabytes per month by 2018.
● Tablets will exceed 10 percent of global mobile data traffic by 2016.
● 4G traffic will be more than half of the total mobile traffic by 2017.
● More traffic will be offloaded from cellular networks (on to Wi-Fi) than remains on cellular networks by 2016.
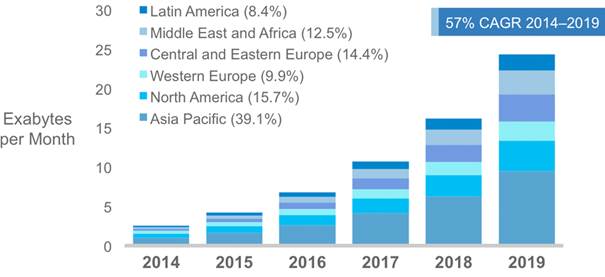
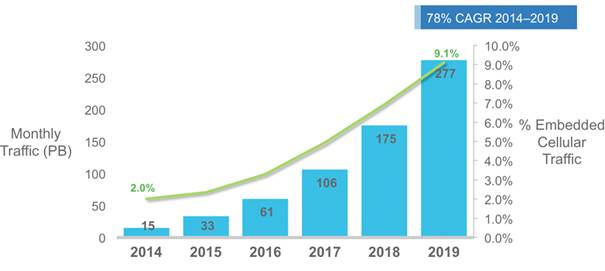
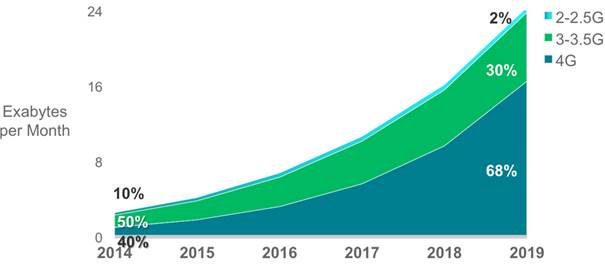
Global mobile data traffic will increase nearly tenfold between 2014 and 2019. Mobile data traffic will grow at a compound annual growth rate (CAGR) of 57 percent from 2014 to 2019, reaching 24.3 exabytes per month by 2019.
By the end of 2015, the number of mobile-connected devices will exceed the number of people on earth, and by 2019 there will be nearly 1.5 mobile devices per capita. There will be 11.5 billion mobile-connected devices by 2019, including M2M modules—exceeding the world’s projected population at that time (7.6 billion).
Mobile network connection speeds will increase more than twofold by 2019. The average mobile network connection speed (1.7 Mbps in 2014) will reach nearly 4.0 megabits per second (Mbps) by 2019. By 2016, average mobile network connection speed will surpass 2.0 Mbps.
By 2019, 4G will be 26 percent of connections, but 68 percent of total traffic. By 2019, a 4G connection will generate 10 times more traffic on average than a non-4G connection.
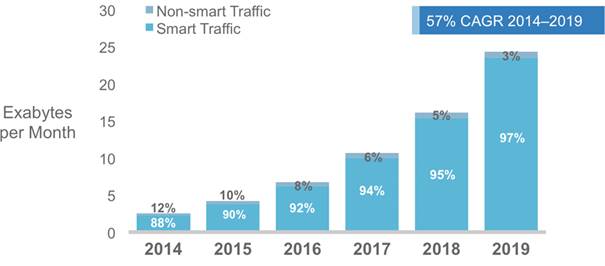
By 2019, more than half of all devices connected to the mobile network will be “smart” devices. Globally, 54 percent of mobile devices will be smart devices by 2019, up from 26 percent in 2014. The vast majority of mobile data traffic (97 percent) will originate from these smart devices by 2019, up from 88 percent in 2014.
By 2019, 54 percent of all global mobile devices could potentially be capable of connecting to an IPv6 mobile network. More than 6.2 billion devices will be IPv6-capable by 2019.
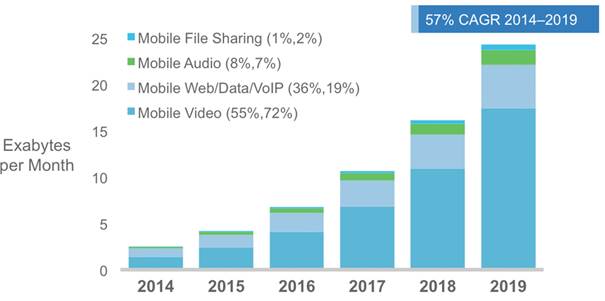
Nearly three-fourths of the world’s mobile data traffic will be video by 2019. Mobile video will increase 13-fold between 2014 and 2019, accounting for 72 percent of total mobile data traffic by the end of the forecast period.
By 2019, mobile-connected tablets will generate nearly double the traffic generated by the entire global mobile network in 2014. The amount of mobile data traffic generated by tablets by 2019 (3.2 exabytes per month) will be 1.3 times higher than the total amount of global mobile data traffic in 2014 (2.5 exabytes per month).
The average smartphone will generate 4.0 GB of traffic per month by 2019, a fivefold increase over the 2014 average of 819 MB per month. By 2019, aggregate smartphone traffic will be 10.5 times greater than it is today, with a CAGR of 60 percent.
By 2016, more than half of all traffic from mobile-connected devices (almost 14 exabytes) will be offloaded to the fixed network by means of Wi-Fi devices and femtocells each month. Without Wi-Fi and femtocell offload, total mobile data traffic would grow at a CAGR of 62 percent between 2014 and 2019, instead of the projected CAGR of 57 percent.
The Middle East and Africa will have the strongest mobile data traffic growth of any region with a 72‑percent CAGR. This region will be followed by Central and Eastern Europe at 71 percent and Latin America at 59 percent.
2014 Year in Review
Global mobile data traffic grew 69 percent in 2014, a growth rate comparable to that in 2012, but lower than that in 2013, which was a “rebound” year after the 2012 slowdown. Growth rates varied widely by region.
All of the emerging market regions experienced a strong growth of mobile data traffic in 2014. (Middle East and Africa grew 107 percent, Latin America grew 87 percent, and Central and Eastern Europe grew 91 percent.) Mobile data traffic grew 69 percent in Asia Pacific, 63 percent in North America, and 45 percent in Western Europe.
Middle East and Africa will experience the highest CAGR of 72 percent, increasing 15-fold over the forecast period.
Central and Eastern Europe will have the second highest CAGR of 71 percent, increasing 14‑fold over the forecast period.
Latin America and Asia Pacific will have CAGRs of 59 percent and 58 percent, respectively.
Global Mobile Data Traffic Forecast by Region
The increasing number of wireless devices that are accessing mobile networks worldwide is one of the primary contributors to global mobile traffic growth. Each year several new devices in different form factors and increased capabilities and intelligence are introduced in the market. Nearly half a billion (497 million) mobile devices and connections were added in 2014. In 2014, global mobile devices and connections grew to 7.4 billion, up from 6.9 billion in 2013. Globally, mobile devices and connections will grow to 11.5 billion by 2019 at a CAGR of 9 percent.
By 2019, there will be 8.2 billion handheld or personal mobile-ready devices and 3.2 billion M2M connections (e.g., GPS systems in cars, asset tracking systems in shipping and manufacturing sectors, or medical applications making patient records and health status more readily available, et al.). Regionally, North America and Western Europe are going to have the fastest growth in mobile devices and connections with 22 percent and 14 percent CAGR from 2014 to 2019, respectively.
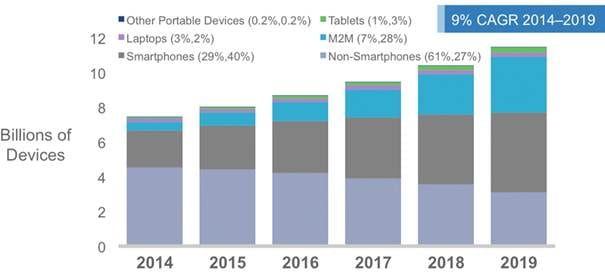
We see a rapid decline in the share of nonsmartphones from more than 61 percent in 2014 (4.5 billion) to less than 27 percent by 2019 (3.1 billion).
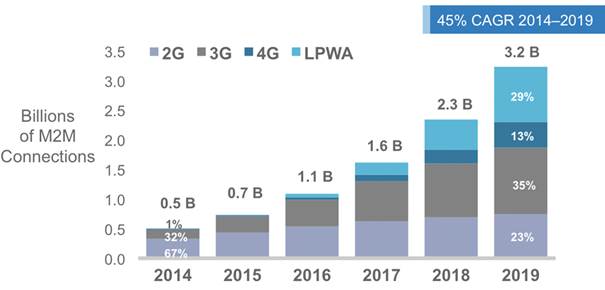
The most noticeable growth is going to occur in M2M connections, followed by tablets. The M2M category is going to grow at 45-percent CAGR from 2014 to 2019, and tablets are going to grow at 32-percent CAGR during the same period.
Although there is an overall growth in the number of mobile devices and connections, there is also a visible shift in the device mix. This year we see a slight slowdown in the growth of tablets as a new device category, phablets (included in our smartphone category), were introduced. Tablet growth was also affected by the availability of lightweight laptops, which are quite similar to tablets in form factor but have more enhanced capabilities. Throughout the forecast period, we see that the device mix is getting smarter with an increasing number of devices with higher computing resources, and network connection capabilities that create a growing demand for more capable and intelligent networks. We define smart devices and connections as those having advanced computing and multimedia capabilities with a minimum of 3G connectivity. As mentioned previously, 497 million mobile devices and connections were added in 2014, and smartphones accounted for 88 percent of that growth at 439 million net adds. The share of smart devices and connections as a percentage of the total will increase from 26 percent in 2014 to more than half, at 54 percent, by 2019, growing 3.3-fold during the forecast period.
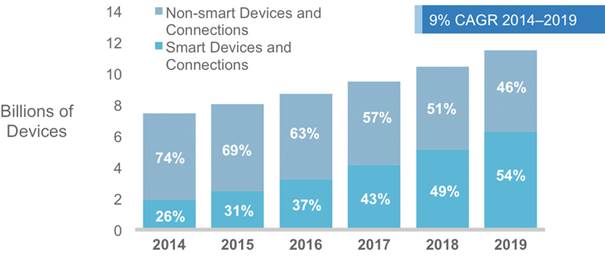
This year we are also including Low Power Wide Area (LPWA) connections in our analysis. This wireless network connectivity is meant specifically for M2M modules that require low bandwidth and wide geographic coverage. Because these modules have very low bandwidth requirements and tolerate high latencies, we do not include them in the smart devices and connections category. For some regions, such as North America where the growth of LPWA is expected to be high, their inclusion in the mix would skew the smart devices and connections percentage, so for regional comparison we have taken them out of the mix. Figure 5 provides a comparable global smart-to-nonsmart devices and connections split, excluding LPWA.
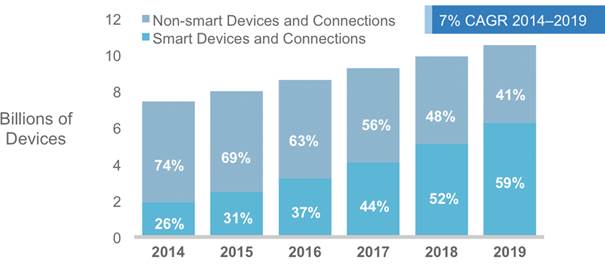
When we exclude LPWA M2M connections from the mix, the global percentage share of smart devices and connections is higher, at 59 percent by 2019.
Although it is a global phenomenon, some regions are ahead in this device mix conversion. By the end of 2019 North America will have nearly 90 percent of its installed base converted to smart devices and connections, followed by Western Europe with 78 percent smart devices and connections.
|
Region
|
2014
|
2019
|
|
North America
|
72%
|
89%
|
|
Western Europe
|
48%
|
78%
|
|
Central and Eastern Europe
|
18%
|
62%
|
|
Latin America
|
20%
|
61%
|
|
Asia Pacific
|
24%
|
56%
|
|
Middle East and Africa
|
11%
|
41%
|
The impact of the growth of mobile smart devices and connections on global traffic. Globally, smart traffic is going to grow from 88 percent of the total global mobile traffic to 97 percent by 2019. This percentage is significantly higher than the ratio of smart devices and connections (54% by 2019), because on average a smart device generates much higher traffic than a nonsmart device.
Mobile devices and connections are not only getting smarter in their computing capabilities but are also evolving from lower-generation network connectivity (2G) to higher-generation network connectivity (3G, 3.5G, and 4G or LTE). When device capabilities are combined with faster, higher bandwidth and more intelligent networks, it leads to wide adoption of advanced multimedia applications that contribute to increased mobile and Wi-Fi traffic.
The explosion of mobile applications and phenomenal adoption of mobile connectivity by end users on the one hand and the need for optimized bandwidth management and network monetization on the other hand is fueling the growth of global 4G deployments and adoption. Service providers around the world are busy rolling out 4G networks to help them meet the growing end-user demand for more bandwidth, higher security, and faster connectivity on the move.
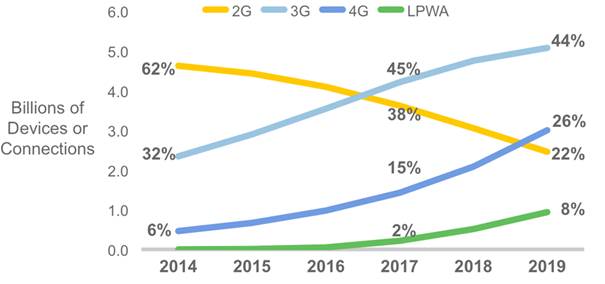
Globally, the relative share of 3G- and 3.5G-capable devices and connections will surpass 2G-capable devices and connections by 2017 (45 percent and 38 percent relative share). The other significant cross-over will occur in 2019, when 4G will also surpass 2G connection share. By 2019, 26 percent of all global devices and connections will be 4G-capable. The global mobile 4G connections will grow from 459 million in 2014 to 3 billion by 2019 at a CAGR of 46 percent.

The transition from 2G to 3G or 4G deployment is a global phenomenon. In fact, by 2019, North America will have 42 percent of its mobile devices and connections with 4G capability, surpassing 3G-capable devices and connections. Western Europe (38 percent) will have the second highest ratio of 4G connections by 2019. At the country level, Australia will have 48 percent of its total connections on 4G by 2019, with Japan having 47 percent of all its connections on 4G by 2019. China, followed by the United States, is going to lead the world in terms of its share of the total global 4G connections with 21 percent and 16 percent, respectively, of total global 4G connections by 2019.
While the growth in 4G, with its higher bandwidth, lower latency, and increased security, will help regions bridge the gap between their mobile and fixed network performance, deployment of LPWA networks will help enhance the reach of mobile providers in the M2M segment. This situation will lead to even higher adoption of mobile technologies by end users, making access to any content on any device from anywhere and the Internet of Everything (IoE) more of a reality.
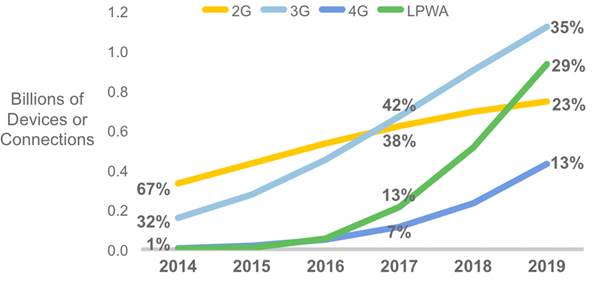
In 2014, 4G accounts for 1% and LPWA accounts for 0.2% of global mobile M2M connections.
Source: Cisco VNI Mobile, 2015
An important factor contributing to the growing adoption of IoE is the emergence of wearable devices, a category with high growth potential. Wearable devices, as the name suggests, are devices that can be worn on a person and have the capability to connect and communicate to the network either directly through embedded cellular connectivity or through another device (primarily a smartphone) using Wi-Fi, Bluetooth, or another technology. These devices come in various shapes and forms, ranging from smart watches, smart glasses, heads-up displays (HUDs), health and fitness trackers, health monitors, wearable scanners and navigation devices, smart clothing, etc..
The growth in these devices has been fueled by enhancements in technology that have supported compression of computing and other electronics (making the devices light enough to be worn). These advances are being combined with fashion to match personal styles, especially in the consumer electronics segment, along with network improvements and the growth of applications, such as location-based services and augmented reality. Although there have been vast technological improvements to make wearables possible as a significant device category, wide-scale availability of embedded cellular connectivity still has some barriers to overcome for some applications—such as technology limitations, regulatory constraints, and health concerns.
By 2019, we estimate that there will be 578 million wearable devices globally, growing fivefold from 109 million in 2014 at a CAGR of 40 percent. As mentioned earlier, there will be limited embedded cellular connectivity in wearables through the forecast period. Only 7 percent will have embedded cellular connectivity by 2019, up from 2 percent in 2014. Currently, we do not include wearables as a separate device and connections category because it is at a nascent stage, so there is a noted overlap with the M2M category. We will continue to monitor this segment, and as the category grows and becomes more significant, we may break it out in future forecast iterations.
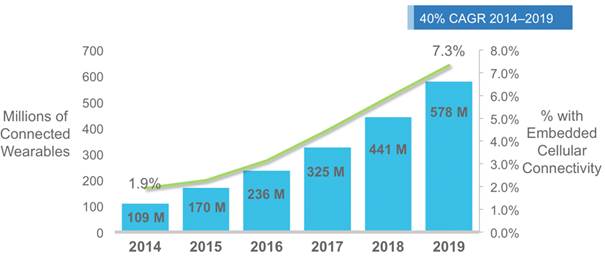
Regionally, North America will have the largest regional share of wearables, with 33-percent share by 2019. Other regions with significant share include Asia Pacific with 34 percent share in 2014, declining slightly to 32 percent by 2019.
The wearables category will have a tangible impact on mobile traffic, because even without embedded cellular connectivity they can connect to mobile networks through smartphones.
Because mobile video content has much higher bit rates than other mobile content types, mobile video will generate much of the mobile traffic growth through 2019. Mobile video will grow at a CAGR of 66 percent between 2014 and 2019, the highest growth rate of any mobile application category that we forecast other than M2M traffic. Of the 24.3 exabytes per month crossing the mobile network by 2019, 17.4 exabytes will be due to video. Mobile video represented more than half of global mobile data traffic beginning in 2012, indicating that it is having an immediate impact on traffic today, not just in the future.
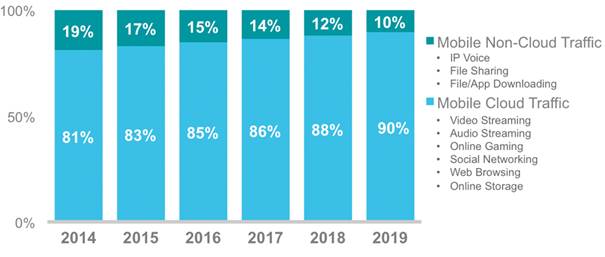
Because many Internet video applications can be categorized as cloud applications, mobile cloud traffic follows a curve similar to video. Mobile devices have memory and speed limitations that might prevent them from acting as media consumption devices, were it not for cloud applications and services.
Cloud applications and services such as Netflix, YouTube, Pandora, and Spotify allow mobile users to overcome the memory capacity and processing power limitations of mobile devices. Globally, cloud applications will account for 90 percent of total mobile data traffic by 2019, compared to 81 percent at the end of 2014. Mobile cloud traffic will grow 11-fold from 2014 to 2019, a CAGR of 60 percent.
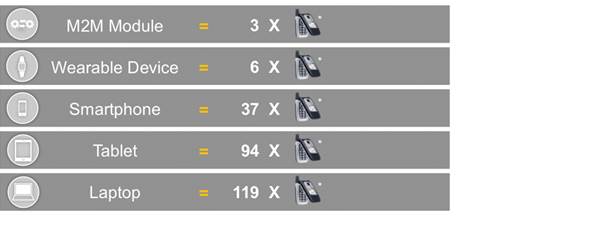
The proliferation of high-end handsets, tablets, and laptops on mobile networks is a major traffic generator, because these devices offer the consumer content and applications not supported by previous generations of mobile devices, a single smartphone can generate as much traffic as 37 basic-feature phones; a tablet as much traffic as 94 basic-feature phones; and a single laptop can generate as much traffic as 119 basic-feature phones.
* Monthly basic mobile phone data traffic.
Average traffic per device is expected to increase rapidly during the forecast period, as shown in the below table.
Summary of Per-Device Usage Growth, MB per Month
|
Device Type
|
2014
|
2019
|
|
Nonsmartphone
|
22 MB/month
|
105 MB/month
|
|
M2M Module
|
70 MB/month
|
366 MB/month
|
|
Wearable Device
|
141 MB/month
|
479 MB/month
|
|
Smartphone
|
819 MB/month
|
3,981 MB/month
|
|
4G Smartphone
|
2,000 MB/month
|
5,458 MB/month
|
|
Tablet
|
2,076 MB/month
|
10,767 MB/month
|
|
4G Tablet
|
2,913 MB/month
|
12,314 MB/month
|
|
Laptop
|
2,641 MB/month
|
5,589 MB/month
|
The growth in usage per device outpaces the growth in the number of devices. As shown in Table 4, the growth rate of mobile data traffic from new devices is two to five times greater than the growth rate of users.
Comparison of Global Device Unit Growth and Global Mobile Data Traffic Growth
|
Device Type
|
Growth in Devices,
2014–2019 CAGR |
Growth in Mobile Data Traffic, 2014–2019 CAGR
|
|
Smartphone
|
16.7%
|
60.1%
|
|
Tablet
|
32.0%
|
83.4%
|
|
Laptop
|
5.3%
|
22.3%
|
|
M2M Module
|
45.5%
|
102.7%
|
A few of the main promoters of growth in average usage are described in the following list:
● As mobile network connection speeds increase, the average bit rate of content accessed through the mobile network will increase. High-definition video will be more prevalent, and the proportion of streamed content, as compared to side-loaded content, is also expected to increase with average mobile network connection speed.
● The shift toward on-demand video will affect mobile networks as much as it will affect fixed networks. Traffic can increase dramatically, even while the total amount of time spent watching video remains relatively constant.
● As mobile network capacity improves and the number of multiple-device users grows, operators are more likely to offer mobile broadband packages comparable in price and speed to those of fixed broadband. This situation is encouraging mobile broadband substitution for fixed broadband, where the usage profile is substantially higher than average.
● Mobile devices increase an individual’s contact time with the network, and it is likely that this increased contact time will lead to an increase in overall minutes of use per user. However, not all of the increase in mobile data traffic can be attributed to traffic migration to the mobile network from the fixed network. Many uniquely mobile applications continue to emerge, such as location-based services, mobile-only games, and mobile commerce applications.
Impact of 4G
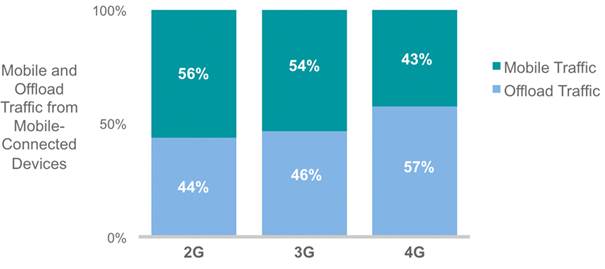
While 3G and 3.5G account for the majority (60 percent) of mobile data traffic today, 4G will grow to represent more than two-thirds of all mobile data traffic by 2019, despite a connection share of only 26 percent (Figure 16).
Currently, a 4G connection generates nearly 10 times more traffic than a non-4G connection. There are two reasons. The first is that many 4G connections today are for high-end devices, which have a higher average usage. The second is that higher speeds encourage the adoption and usage of high-bandwidth applications, such that a smartphone on a 4G network is likely to generate significantly more traffic than the same model smartphone on a 3G or 3.5G network. As smartphones come to represent a larger share of 4G connections, the gap between the average traffic of 4G devices and non-4G devices will narrow, but by 2019 a 4G connection will still generate 5 times more traffic than a non-4G connection.
Much mobile data activity takes place within users’ homes. For users with fixed broadband and Wi-Fi access points at home, or for users served by operator-owned femtocells and picocells, a sizable proportion of traffic generated by mobile and portable devices is offloaded from the mobile network onto the fixed network. For the purposes of this study, offload pertains to traffic from dual-mode devices (i.e., supports cellular and Wi-Fi connectivity; excluding laptops) over Wi-Fi and small-cell networks. Offloading occurs at the user/device level when one switches from a cellular connection to Wi-Fi/small-cell access. Our mobile offload projections include traffic from both public hotspots as well as residential Wi-Fi networks.
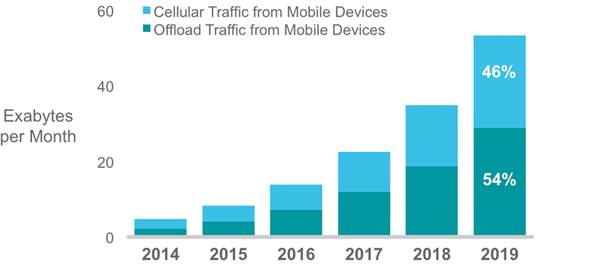
As a percentage of total mobile data traffic from all mobile-connected devices, mobile offload increases from 45 percent (1.2 exabytes/month) in 2014 to 54 percent (28.9 exabytes/month) by 2019.
Without offload, Global mobile data traffic would grow at a CAGR of 62 percent instead of 57 percent. Offload volume is determined by smartphone penetration, dual-mode share of handsets, percentage of home-based mobile Internet use, and percentage of dual-mode smartphone owners with Wi-Fi fixed Internet access at home.
Offload pertains to traffic from dual mode devices (excluding laptops) over Wi-Fi/small cell networks.
The amount of traffic offloaded from smartphones will be 54 percent by 2019, and the amount of traffic offloaded from tablets will be 70 percent.
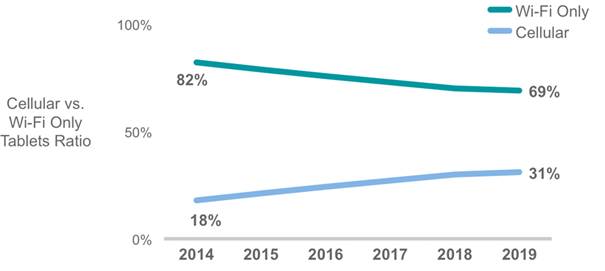
A supporting trend is the growth of cellular connectivity for devices such as tablets, which in their earlier generation were limited to Wi-Fi connectivity only. With increased desire for mobility and mobile carriers that offer data plans catering to multidevice owners, we find that cellular connectivity is on a rise, albeit cautiously, as the end users are “testing the waters.” As a point in case, we estimate that by 2019, 31 percent of all tablets will have a cellular connection, up from 18 percent in 2014.
Some have speculated that Wi-Fi offload will be less relevant after 4G networks are in place because of the faster speeds and more abundant bandwidth. However, 4G networks will attract high-usage devices such as advanced smartphones and tablets, and it appears that 4G plans will be subject to data caps similar to 3G plans. For these reasons, Wi-Fi offload is higher on 4G networks than on lower-speed networks, now and in the future according to our projections. The amount of traffic offloaded from 4G was 44 percent at the end of 2014, and it will be 57 percent by 2019. The amount of traffic offloaded from 3G will be 49 percent by 2019, and the amount of traffic offloaded from 2G will be 46 percent.
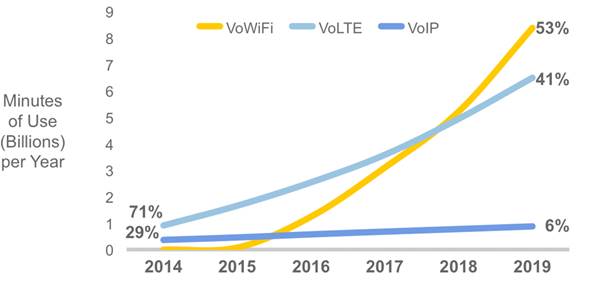
Note: VoLTE and VoIP are mobile-specific, VoWi-Fi could be from any Wi-Fi connection. Circuit-switched mobile voice is excluded from the mix. It would grow at 5 percent CAGR.
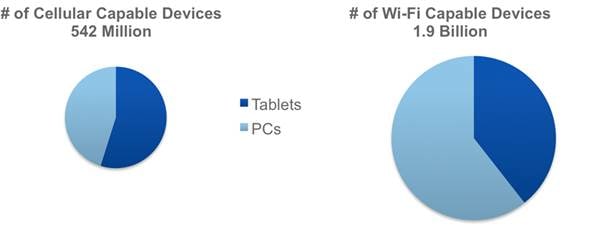
Because VoWi-Fi is a native application, it has its advantages over VoIP in terms of faster and higher-quality performance besides providing keypad and contact-list integration. VoWi-Fi can also be delivered over non-SIM devices, but the coverage and usage would be much larger relative to VoLTE. Figure 21 shows how the number of tablets and PCs connected on Wi-Fi will far exceed those with cellular connectivity.
Global and Regional Projected Average Mobile Network Connection Speeds (in kbps)
| |
2014
|
2014
|
2015
|
2016
|
2017
|
2019
|
CAGR
2014–2019 |
|
Global
| |||||||
|
Global speed: All handsets
|
1,683
|
1,747
|
2,017
|
2,629
|
3,248
|
3,963
|
9%
|
|
Global speed: Smartphones
|
6,097
|
6,899
|
7,686
|
8,468
|
8,829
|
10,403
|
11%
|
|
Global speed: Tablets
|
8,697
|
10,203
|
10,907
|
12,119
|
12,403
|
13,054
|
8%
|
|
By Region
| |||||||
|
Middle East & Africa
|
582
|
700
|
742
|
1,095
|
1,577
|
2,097
|
29%
|
|
Central & Eastern Europe
|
1,620
|
1,939
|
2,353
|
2,762
|
3,167
|
3,671
|
18%
|
|
Latin America
|
1,378
|
1,556
|
1,781
|
2,077
|
2,463
|
2,949
|
16%
|
|
Western Europe
|
2,037
|
2,452
|
2,916
|
3,408
|
3,910
|
4,687
|
18%
|
|
Asia-Pacific
|
2,026
|
2,233
|
2,443
|
2,730
|
3,047
|
3,509
|
12%
|
|
North America
|
2,816
|
3,052
|
3,542
|
4,299
|
5,196
|
6,399
|
18%
|
Current and historical speeds are based on data from Ookla’s Speedtest. Forward projections for mobile data speeds are based on third-party forecasts for the relative proportions of 2G, 3G, 3.5G, and 4G among mobile connections through 2019.
Source: Cisco VNI Mobile, 2015
Several variables affect the performance of a mobile connection: Rollout of 2G/3G/4G in various countries and regions, technology used by the cell towers, spectrum availability, terrain, signal strength, and number of devices sharing a cell tower.
The type of application being used by the end user is also an important factor. Download speed, upload speed, and latency characteristics vary widely depending on the type of application, be it video, radio, or instant messaging.
Mobile Speeds by Technology: 2G vs. 3G vs. 4G
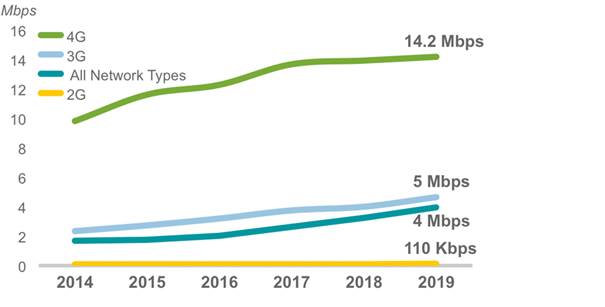
By 2019, 4G speeds will be four times higher than that of an average mobile connection. In comparison, 3G speeds will be 1.2-fold as fast as the average mobile connection by 2019.
Mobile Speeds by Device

Source:
http://www.cisco.com/c/en/us/solutions/collateral/service-provider/visual-networking-index-vni/white_paper_c11-520862.html
Here are some free tricks on HOW TO get free daily traffic:
ReplyDeleteCollect free ad credits daily from MellowAds Faucet.
Free online games are very popular as they can be played free and for the entertainment they provide. https://messari.io/research/person/sergey-sholom
ReplyDelete